Workbook Flow
See how the workbook is actually wired.
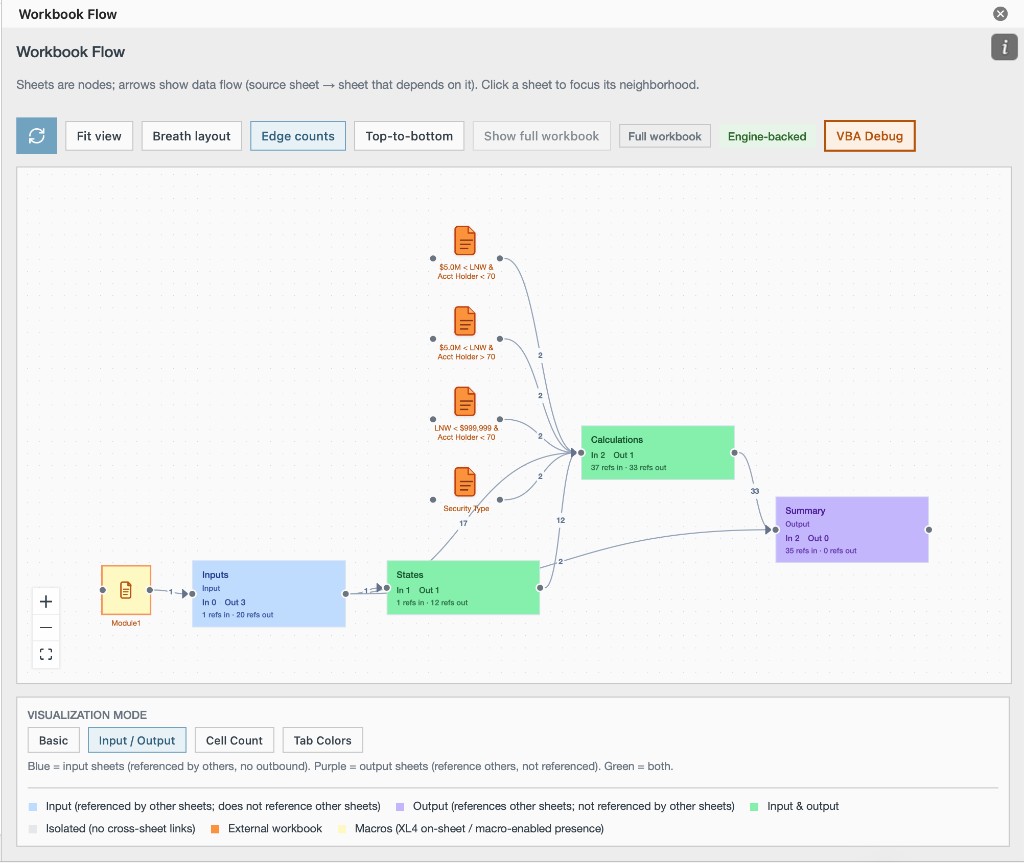
Workbook Flow maps cross-sheet formula relationships as an interactive graph, so you can tell inputs from outputs in a model you didn't build.
The problem
Sheet tabs do not show the wiring.
A model with a dozen sheets rarely documents which ones feed which. Cross-sheet formula relationships are the map — once you can see them as a graph, inputs and outputs stop being a guess.
What it does
Directed sheet-dependency graph
Pan and zoom across sheets connected by formula references. Edges show direction: who feeds whom.
Input / output classification
Sheets are classified by reference linkage so you can tell inputs from outputs at a glance.
Additional views
Switch to views for cell count and tab colors when you need a different cut of the same structure.
External workbook and macro nodes
External workbooks and macro-related nodes appear in the graph when they participate in the wiring.
Drill into an edge
Click an edge to see the formulas that create the connection, then jump to one.
What Mac-Cel doesn't claim
- Workbook Flow maps relationships between sheets, not between individual cells.
- It does not highlight circular dependencies — that is Formula Spy.
- Diagrams cannot currently be exported.
Who it's for
- Anyone opening a multi-sheet model they did not build.
- Reviewers who need to know which sheets are inputs before they dig into cells.
- Teams documenting model structure without writing a separate architecture note.